
Almanac Table of Contents | Chapter Nine Table of Contents | TEC Home Page
NEXT PAGE * PREVIOUS PAGE Go to page 1*2*3*4*5*6*7*Notes

Industrial solid waste can be managed either on-site - at the facility where it is generated - or off-site at commercial facilities. Whether on-site or off-site, industrial solid waste can be disposed of through the use of municipal and industrial wastewater facilities; land disposal facilities such as landfills, waste pits - principally for petroleum exploration waste - and deep underground injection wells; and incineration or waste-to-energy facilities like cement kilns. A variety of treatment, recycling and other management options also exist for many types of industrial waste.
About 96 percent of hazardous waste and 99 percent of Class 1 waste were managed on site (at the facility where the waste is generated) in 1991. The majority of on-site management is through wastewater treatment facilities, which consist of storage and treatment tanks as well as more complex wastewater treatment.(46) Once the level of hazardous waste is decreased to a certain level by treatment, the water is then discharged, either through a publicly-owned (wastewater) treatment works or from the industrial facility itself. Besides on-site waste-water facilities, most of the other waste managed on-site was injected underground into deep wells.(47)

Source: Texas Water Commission, Trends in Texas Hazardous Waste Management, (Austin: TWC, July 1993).

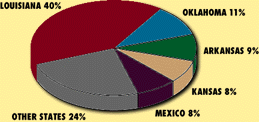
Percent of total exports to other U.S. states and Mexico, 1991.
Source: Texas Water Commission, Trends in Texas Hazardous Waste Management, (Austin: TWC, July 1993).

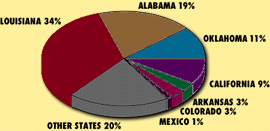
Percent of total exports from other U.S. states and Mexico, 1991.
Source: Texas Water Commission, Trends in Texas Hazardous Waste Management, (Austin: TWC, July 1993).

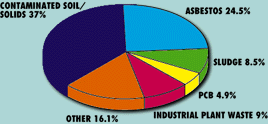
TOTAL: 398,000 TONS
Source: Kathey Ferland, Waste Management Policy Division, Texas Water Commission, Interoffice Memorandum, June 3, 1993.
| ACROSS THE BORDER WOES |
|---|
|
Maquiladoras are manufacturing plants located in Mexico which import at least 75 percent of their raw materials, assemble them in Mexico and export a finished product, usually to the U.S. In 1991, 673 maquiladoras were located along the Texas-Mexico border.(53) Most of these maquiladoras are at least partially owned by U.S. corporations and use U.S. raw materials to make products such as semiconductors, electronic components, chemicals and auto parts.
Under both Mexican law and a U.S.-Mexico agreement, the waste from production must also be returned to the country from which the raw materials were imported.(54) Despite this requirement, however, Texas commercial facilities reportedly only treated 1,800 tons of hazardous waste from Mexico in 1991.(55) While little is known about the actual amount of hazardous waste generated in maquila plants, evidence suggests that the volume of hazardous waste is many times higher than what is returned. The World Bank, for example, estimated that 80 percent of the hazardous waste is not repatriated, but remains stored on-site or is otherwise illegally disposed of in Mexico.(56) A new hazardous waste tracking system, called HAZTRAKS, was implemented in 1993 by the Environmental Protection Agency to better track how much hazardous waste was being imported from Mexico and to also help determine if hazardous waste regulations were being violated. The computer system uses the "cradle-to-grave" hazardous waste manifests to record the waste from its initial generation and transport to its disposal. EPA officials are sent manifests from U.S. Customs about a week after the shipments cross the border, while the final manifests finally reach HAZTRAKS some six months after the border crossing. In addition, Mexico has provided information to the system from its import and export guides filed by companies with its government. Mexico also currently has a ban on the import of hazardous waste for disposal. However, the country does allow the import of waste if it is used to recycle or recover valuable materials. For example, cement kiln facilities are allowed to import hazardous waste if they use it to help power their production process. This recycling exemption on the ban of hazardous waste is controversial. In 1991, Texas industries shipped about 25,224 tons of hazardous waste to commercial management facilities for recycling in Mexico.(57) |
| WASTE IMPORTED FROM MEXICO INTO TEXAS CLASSIFIED AS RCRA WASTE, 1992 (IN TONS) | |
|---|---|
| Number of Manifests | 476 |
| Total Tons Imported | 2,877 |
| Source: EPA Region 6 Hazardous Waste Tracking System | |
| WHAT ARE "TOXICS" AND WHERE DO THEY GO? |
|---|
|
All major manufacturing industries must report their releases and transfers of more than 300 individual toxic chemicals and 20 toxic chemi-cal compounds - chemicals which have been determined to be harmful to humans and/or the environment - to both the Environmental Protection Agency and the Texas Natural Resource Conservation Commission. Of these specific chemicals, 123 are defined as carcino-gens based on work-place standards, while chemicals like ozone depleters may affect the environment more directly than humans.(60)
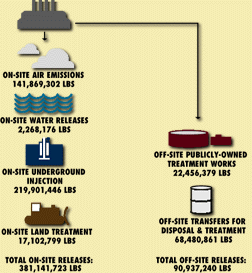
Texas facilities released 381 million pounds of these toxic chemicals in 1993 to the air, water and land -- both above and below the ground -- while transferring another 91 million pounds to other authorized facilities for treatment, storage and disposal.(61) Texas is the second largest volume producer of toxic chemical releases and the largest producer of releases and transfers in the country.(62) However, it should be noted that Texas is also the second largest state in terms of population, and has the largest concentration of certain types of industries such as chemicals and petroleum refining. From 1987 to 1993, Texas showed a 23.2 percent reduction in on-site releases and off-site transfers.(63) In fact, Texas industries have reduced toxic productions faster than industries in other states. However, interpreting these numbers is difficult. Each year there are a different number of facilities reporting. The amount of toxic releases and transfers is affected by the amount of production and general economic conditions. Still, most major companies have significantly reduced toxic releases over the last five years (see section on waste minimization and source reduction). |
| TOXICS RELEASED ON-SITE AND TREATED OFF-SITE IN TEXAS, 1987 TO 1993 (UNITS IN MILLIONS OF POUNDS) | ||||||||
|---|---|---|---|---|---|---|---|---|
| 1987 | 1988 | 1989 | 1990 | 1991 | 1992 | 1993 | NET % CHANGE | |
| Non-point Air | 136.2 | 103.0 | 96.2 | 85.7 | 79.9 | 76.9 | 69.1 | -49.2% |
| Point Air | 100.7 | 109.0 | 100.0 | 94.3 | 90.0 | 82.5 | 72.7 | -27.7% |
| Total Air | 236.8 | 212.0 | 196.3 | 179.9 | 169.8 | 159.3 | 141.9 | -40.1% |
| Water Releases | 4.7 | 4.3 | 4.5 | 4.0 | 2.9 | 16.4 | 2.3 | -51.4% |
| Underground Injection | 185.7 | 212.9 | 220.7 | 244.9 | 224.0 | 227.5 | 219.9 | +18.4% |
| Land Releases | 22.8 | 35.1 | 20.9 | 18.3 | 13.8 | 17.9 | 17.1 | -24.9% |
| Publicly Owned Treatment Works (POTW) | 52.5 | 45.5 | 42.2 | 41.3 | 31.3 | 31.2 | 22.5 | -57.3% |
| Off-site Transfers for Disposal/Treatment | 112.4 | 82.0 | 86.2 | 79.7 | 79.3 | 69.8 | 68.5 | -39.1% |
| Total On-site Releases and Off-site Disposal/Treatment | 615.0 | 591.8 | 570.8 | 568.2 | 521.1 | 522.1 | 472.1 | -23.2% |
| Source: Table prepared by Toxics Release Inventory Program, Office of Pollution Prevention and Recycling, Texas Natural Resource Conservation Commission. | ||||||||

Source: Table prepared by Toxics Release Inventory Program, Office of Pollution Prevention and Recycling, Texas Natural Resource Conservation Commission.
| TOXIC RELEASES BY TYPE OF INDUSTRY, 1993 | |
|---|---|
| Food and Kindred Products | 0.97% |
| Lumber and Wood Products | 0.39% |
| Paper and Allied Products | 1.97% |
| Chemicals and Allied Products | 74.85% |
| Petroleum Refining and Related Industries | 11.88% |
| Rubber and Miscellaneous Plastics Products | 1.76% |
| Stone, Clay, Glass and Concrete Products | 0.55% |
| Primary Metal Industries | 2.89% |
| Fabricated Metal Products | 1.35% |
| Industrial and Commercial Machinery and Computer Equipment | 0.26% |
| Electronic and Other Electrical Equipment and Components | 0.44% |
| Transportation Equipment | 1.32% |
| Others | 1.37% |
| Total: 352.1 million pounds | |
| Note: The total of 352.1 million pounds has since been adjusted upward to 381.1 million pounds. The adjustment added 28.9 million pounds to underground injection releases. | |
| Source: Toxics Release Inventory Program, Office of Pollution Prevention and Recycling, Texas Natural Resource Conservation Commission. | |
Only 4 percent of hazardous waste in Texas was treated off-site in 1991. That year, 4,414,400 tons of hazardous waste were treated at domestic wastewater facilities; 470,000 tons were treated at commercial facilities in Texas; 315,300 tons were sent out-of-state to commercial facilities; and another 201,300 tons went to other "captive" facilities owned by the same company.(48) More than 40 percent of Texas-generated hazardous waste which went to commercial treatment facilities was exported to other states.(49) Texas imported about the same amount of hazardous waste as it exported. Most of the imported hazardous waste went to commercial deep-well injection facilities.(50)
In addition to these hazardous waste, in 1991 Texas facilities sent 613,700 tons of Class 1 non-hazardous waste - out of 103 million tons generated - to commercial facilities.(51) There are just a few facilities in the state which manage only non-hazardous industrial waste commercially. For example, 398,000 tons of industrial waste were sent to either in-state or out-of-state landfills in 1991.(52) Contaminated soils and solids, asbestos materials and PCB contaminated materials made up about 67 percent of the "non-hazardous" industrial waste. Most of the remainder was shipped to a commercial injection well.
Is there enough space available to take care of all of these waste? In most cases, yes. In a 1994 report on commercial capacity, the TNRCC found that there would be sufficient space to manage Texas waste in 1995, except in the following categories:
The report found that Texas was lacking in some technologies to recycle and destroy hazardous waste, yet (with the exception of landfilling) had enough disposal capacity for waste that can't be destroyed or recycled. It also noted that a limited number of facilities may be available nationally to manage these waste streams.(58) In late 1994, a new hazardous waste landfill in Andrews County was permitted, which should provide additional capacity by 1996.(59)
 TOXIC RELEASES BY TOP 40 COUNTIES, 1993 & 1992
 TOXIC TRANSFERS TO TREATMENT AND DISPOSAL FACILITIES BY TOP 40 COUNTIES, 1993 & 1992
| TOXIC TRANSFERS TO TREATMENT AND DISPOSAL FACILITIES AND TO PUBLICLY-OWNED TREATMENT WORKS BY TYPE OF INDUSTRY | |
|---|---|
| Food and Kindred Products | 6.45% |
| Apparel and Other Finished Products | 0.43% |
| Paper and Allied Products | 9.71% |
| Chemicals and Allied Products | 51.12% |
| Petroleum Refining and Related Industries | 7.48% |
| Stone, Clay, Glass and Concrete | 0.26% |
| Primary Metal Industries | 14.90% |
| Fabricated Metal Products | 4.57% |
| Industrial and Commercial Machinery | 0.20% |
| Electronic and Other Electrical Equipment | 2.17% |
| Transportation Equipment | 0.71% |
| Others | 2.0% |
| Total Transfers: 90.9 million pounds | |
| Source: Toxics Release Inventory Program, Office of Pollution Prevention and Recycling, Texas Natural Resource Conservation Commission. | |
| TOP 20 TEXAS FACILITIES RANKED BY TOTAL TOXIC ONSITE RELEASES, 1993 AND 1992 | ||||
|---|---|---|---|---|
| FACILITY NAME | CITY | COUNTY | TOTAL POUNDS OF ON-SITE RELEASES | |
| 1993 | 1992 | |||
| 1. Monsanto Co. | Alvin | Brazoria | 63,517,095 | 55,888,192 |
| 2. DuPont | Beaumont | Jefferson | 36,817,348 | 40,609,555 |
| 3. BP Chemicals | Port Lavaca | Calhoun | 26,620,979 | 26,859,083 |
| 4. Sterling Chemicals | Texas City | Galveston | 24,709,135 | 37,189,945 |
| 5. DuPont | Victoria | Victoria | 22,471,672 | 23,215,381 |
| 6. Amoco Oil Co. | Texas City | Galveston | 13,196,734 | 16,834,136 |
| 7. American Chrome & Chemicals | Corpus Christi | Nueces | 12,113,360 | 10,159,860 |
| 8. Hoechst-Celanese Chemical | Pasadena | Harris | 10,354,443 | 8,507,260 |
| 9. DuPont | Orange | Orange | 9,731,302 | 6,854,626 |
| 10. Dow Chemical Co. | Freeport | Brazoria | 6,816,577 | 8,838,159 |
| 11. Asarco Inc. | Amarillo | Potter | 5,970,420 | 5,947,230 |
| 12. Texas Eastman Div. | Longview | Harrison | 4,587,163 | 4,388,115 |
| 13. Shell Oil Co. | Deer Park | Harris | 4,542,726 | 8,111,712 |
| 14. Mobil Oil Beaumont Refinery | Beaumont | Jefferson | 4,312,079 | 4,841,534 |
| 15. Merichem Co. | Houston | Harris | 3,832,980 | 3,449,859 |
| 16. Union Carbide Co. | Texas City | Galveston | 3,542,415 | 4,170,148 |
| 17. Quantum Chemical | La Porte | Harris | 3,473,658 | 3,147,968 |
| 18. Hoechst-Celanese Chemical | Bay City | Matagorda | 3,454,971 | 3,758,243 |
| 19. DuPont | La Porte | Harris | 3,155,412 | 4,676,878 |
| 20. Celanese Eng. Resins, Inc. | Bishop | Nueces | 2,800,000 | 3,006,800 |
| Cumulative Total | 69.79% | |||
| Note: 23,000,000 million pounds at the Monsanto Co. in Brazoria County and 5,970,000 pounds at BP Chemicals in Calhoun County not initially reported to the Texas Natural Resource Conservation Commission under the Toxic Release Inventory Program are included in these facility totals. These extra pounds were not included due to the companies' misunderstanding over whether ammonia sulfate had been delisted in 1993. | ||||
| Source: Information from Toxics Release Inventory Program, Office of Pollution Prevention, Texas Natural Resource Conservation Commission. | ||||
| TOP 20 TEXAS FACILITIES RANKED BY OFF-SITE TREATMENT AND DISPOSAL TRANSFERS,1993 AND 1992 | ||||
|---|---|---|---|---|
| FACILITY NAME | CITY | COUNTY | TOTAL POUNDS TRANSFERRED | |
| 1993 | 1992 | |||
| 1. Phelps Dodge Refining | El Paso | El Paso | 12,585,020 | 11,552,610 |
| 2. Rhone-Poulenc Basic Chemicals | Baytown | Harris | 6,352,707 | 6,821,213 |
| 3. IBP Inc. | Amarillo | Potter | 4,207,550 | 899,400 |
| 4. ISK Biosciences | Houston | Harris | 3,283,427 | 1,194,873 |
| 5. Shell Oil Co. | Deer Park | Harris | 3,282,427 | 2,510,672 |
| 6. Occidental Chemical | Deer Park | Harris | 2,793,487 | 3,390,903 |
| 7. PD Glycol | Beaumont | Jefferson | 2,424,011 | 2,270,929 |
| 8. Miles Inc. | Baytown | Chambers | 1,894,434 | 1,829,165 |
| 9. Sea Lion Tech. | Texas City | Galveston | 1,480,440 | 1,552,330 |
| 10. Lyondell-Citgo Refining | Houston | Harris | 1,450,485 | 1,684,045 |
| 11. DuPont | La Porte | Harris | 1,254,331 | 3,709,610 |
| 12. Occidental Chemical | Wadsworth | Matagorda | 1,250,727 | 1,609,291 |
| 13. Dixie Chemical Co. | Pasadena | Harris | 1,207,471 | 308,797 |
| 14. Howell Hydrocarbons | Channelview | Harris | 1,100,100 | 5 |
| 15. United Galvanizing | Houston | Harris | 1,071,277 | 115,221 |
| 16. Coastal Refining & Marketing | Corpus Christi | Nueces | 966,226 | 134,765 |
| 17. Arco Chemical Co. | Channelview | Harris | 859,667 | 989,949 |
| 18. Motorola Inc. | Austin | Travis | 828,332 | 859,270 |
| 19. Metalplate Galvanizing | Houston | Harris | 776,000 | 660,000 |
| 20. DuPont | Beaumont | Jefferson | 720,301 | 888,662 |
| Cumulative Total | 72.70% | |||
| Source: Toxics Release Inventory Program, Office of Pollution Prevention and Recycling, Texas Natural Resource Conservation Commission. | ||||

NEXT PAGE * PREVIOUS PAGE Go to page 1*2*3*4*5*6*7*Notes

Please send questions, comments, or problems with this page to ltarver@mail.utexas.edu.